422 KiB
Uczenie maszynowe UMZ 2017/2018
2. Regresja logistyczna
Część 2
2.5. Regresja wielomianowa
Wybór cech
Zadanie: przewidzieć cenę działki o kształcie prostokąta.
Jakie cechy wybrać?
- $x_1$ – szerokość działki, $x_2$ – długość działki: $$ h_{\theta}(\vec{x}) = \theta_0 + \theta_1 x_1 + \theta_2 x_2 $$
- $x_1$ – powierzchnia działki: $$ h_{\theta}(\vec{x}) = \theta_0 + \theta_1 x_1 $$
Regresja wielomianowa
# Przydtne importy

import ipywidgets as widgets
import matplotlib.pyplot as plt
import numpy as np
import pandas

%matplotlib inline
# Przydatne funkcje
# Wersja macierzowa funkcji kosztu
def cost(theta, X, y):
m = len(y)
J = 1.0 / (2.0 * m) * ((X * theta - y).T * (X * theta - y))
return J.item()
# Wersja macierzowa gradientu funkcji kosztu
def gradient(theta, X, y):
return 1.0 / len(y) * (X.T * (X * theta - y))
# Algorytm gradientu prostego (wersja macierzowa)
def gradient_descent(fJ, fdJ, theta, X, y, alpha=0.1, eps=10**-5):
current_cost = fJ(theta, X, y)
logs = [[current_cost, theta]]
while True:
theta = theta - alpha * fdJ(theta, X, y)
current_cost, prev_cost = fJ(theta, X, y), current_cost
if abs(prev_cost - current_cost) > 10**15:
print('Algorithm does not converge!')
break
if abs(prev_cost - current_cost) <= eps:
break
logs.append([current_cost, theta])
return theta, logs
# Wykres danych (wersja macierzowa)
def plot_data(X, y, xlabel, ylabel):
fig = plt.figure(figsize=(16*.6, 9*.6))
ax = fig.add_subplot(111)
fig.subplots_adjust(left=0.1, right=0.9, bottom=0.1, top=0.9)
ax.scatter([X[:, 1]], [y], c='r', s=50, label='Dane')
ax.set_xlabel(xlabel)
ax.set_ylabel(ylabel)
ax.margins(.05, .05)
plt.ylim(y.min() - 1, y.max() + 1)
plt.xlim(np.min(X[:, 1]) - 1, np.max(X[:, 1]) + 1)
return fig
# Wykres funkcji fun
def plot_fun(fig, fun, X):
ax = fig.axes[0]
x0 = np.min(X[:, 1]) - 1.0
x1 = np.max(X[:, 1]) + 1.0
Arg = np.arange(x0, x1, 0.1)
Val = fun(Arg)
return ax.plot(Arg, Val, linewidth='2')# Wczytanie danych (mieszkania) przy pomocy biblioteki pandas
alldata = pandas.read_csv('data_flats.tsv', header=0, sep='\t',
usecols=['price', 'rooms', 'sqrMetres'])
data = np.matrix(alldata[['sqrMetres', 'price']])
m, n_plus_1 = data.shape
n = n_plus_1 - 1
Xn = data[:, 0:n]
Xn /= np.amax(Xn, axis=0)
Xn2 = np.power(Xn, 2)
Xn2 /= np.amax(Xn2, axis=0)
Xn3 = np.power(Xn, 3)
Xn3 /= np.amax(Xn3, axis=0)
X = np.matrix(np.concatenate((np.ones((m, 1)), Xn), axis=1)).reshape(m, n + 1)
X2 = np.matrix(np.concatenate((np.ones((m, 1)), Xn, Xn2), axis=1)).reshape(m, 2 * n + 1)
X3 = np.matrix(np.concatenate((np.ones((m, 1)), Xn, Xn2, Xn3), axis=1)).reshape(m, 3 * n + 1)
y = np.matrix(data[:, -1]).reshape(m, 1)Postać ogólna regresji wielomianowej:
$$ h_{\theta}(x) = \sum_{i=1}^{n} \theta_i x^i $$
# Funkcja regresji wielomianowej

def h_poly(Theta, x):
    return sum(theta * np.power(x, i) for i, theta in enumerate(Theta.tolist()))

def polynomial_regression(theta):
    return lambda x: h_poly(theta, x)
Funkcja kwadratowa:
$$ h_{\theta}(x) = \theta_0 + \theta_1 x + \theta_2 x^2 $$
fig = plot_data(X2, y, xlabel='x', ylabel='y')
theta_start = np.matrix([0, 0, 0]).reshape(3, 1)
theta, logs = gradient_descent(cost, gradient, theta_start, X2, y)
plot_fun(fig, polynomial_regression(theta), X)
[<matplotlib.lines.Line2D at 0x7f39d752eb10>]
Funkcja sześcienna:
$$ h_{\theta}(x) = \theta_0 + \theta_1 x + \theta_2 x^2 + \theta_3 x^3 $$
fig = plot_data(X3, y, xlabel='x', ylabel='y')
theta_start = np.matrix([0, 0, 0, 0]).reshape(4, 1)
theta, _ = gradient_descent(cost, gradient, theta_start, X3, y)
plot_fun(fig, polynomial_regression(theta), X)

print(theta)
[[ 397519.38046962] [ -841341.14146733] [ 2253713.97125102] [ -244009.07081946]]
Regresję wielomianową można potraktować jako szczególny przypadek regresji liniowej wielu zmiennych:
$$ h_{\theta}(x) = \theta_0 + \theta_1 x + \theta_2 x^2 + \theta_3 x^3 $$ $$ x_1 = x, \quad x_2 = x^2, \quad x_3 = x^3, \quad \vec{x} = \left[ \begin{array}{ccc} x_0 \\ x_1 \\ x_2 \end{array} \right] $$
Uwaga praktyczna: przyda się normalizacja cech, szczególnie skalowanie!
W ten sposób możemy stosować również inne „pochodne” cechy, np.:
$$ h_{\theta}(x) = \theta_0 + \theta_1 x + \theta_2 \sqrt{x} $$ $$ x_1 = x, \quad x_2 = \sqrt{x}, \quad \vec{x} = \left[ \begin{array}{ccc} x_0 \\ x_1 \end{array} \right] $$
Wielomianowa regresja logistyczna
Podobne modyfikacje cech możemy również stosować dla regresji logistycznej.
def powerme(x1,x2,n):
    X = []
    for m in range(n+1):
        for i in range(m+1):
            X.append(np.multiply(np.power(x1,i),np.power(x2,(m-i))))
    return np.hstack(X)
# Wczytanie danych
import pandas
import numpy as np
alldata = pandas.read_csv('polynomial_logistic.tsv', sep='\t')
data = np.matrix(alldata)
m, n_plus_1 = data.shape
n = n_plus_1 - 1
Xn = data[:, 1:]
Xpl = powerme(data[:, 1], data[:, 2], n)
Ypl = np.matrix(data[:, 0]).reshape(m, 1)
data[:10]matrix([[ 1. , 0.36596696, -0.11214686],
[ 0. , 0.4945305 , 0.47110656],
[ 0. , 0.70290604, -0.92257983],
[ 0. , 0.46658862, -0.62269739],
[ 0. , 0.87939462, -0.11408015],
[ 0. , -0.331185 , 0.84447667],
[ 0. , -0.54351701, 0.8851383 ],
[ 0. , 0.91979241, 0.41607012],
[ 0. , 0.28011742, 0.61431157],
[ 0. , 0.94754363, -0.78307311]])# Wykres danych (wersja macierzowa)
def plot_data_for_classification(X, Y, xlabel, ylabel):
fig = plt.figure(figsize=(16*.6, 9*.6))
ax = fig.add_subplot(111)
fig.subplots_adjust(left=0.1, right=0.9, bottom=0.1, top=0.9)
X = X.tolist()
Y = Y.tolist()
X1n = [x[1] for x, y in zip(X, Y) if y[0] == 0]
X1p = [x[1] for x, y in zip(X, Y) if y[0] == 1]
X2n = [x[2] for x, y in zip(X, Y) if y[0] == 0]
X2p = [x[2] for x, y in zip(X, Y) if y[0] == 1]
ax.scatter(X1n, X2n, c='r', marker='x', s=50, label='Dane')
ax.scatter(X1p, X2p, c='g', marker='o', s=50, label='Dane')
ax.set_xlabel(xlabel)
ax.set_ylabel(ylabel)
ax.margins(.05, .05)
return figfig = plot_data_for_classification(Xpl, Ypl, xlabel=r'$x_1$', ylabel=r'$x_2$')Propozycja hipotezy:
$$ h_\theta(x) = g(\theta^T x) = g(\theta_0 + \theta_1 x_1 + \theta_2 x_2 + \theta_3 x_3 + \theta_4 x_4 + \theta_5 x_5) ; , $$
gdzie $g$ – funkcja logistyczna, $x_3 = x_1^2$, $x_4 = x_2^2$, $x_5 = x_1 x_2$.
def safeSigmoid(x, eps=0):
    y = 1.0/(1.0 + np.exp(-x))
    if eps > 0:
        y[y < eps] = eps
        y[y > 1 - eps] = 1 - eps
    return y

def h(theta, X, eps=0.0):
    return safeSigmoid(X*theta, eps)

def J(h,theta,X,y, lamb=0):
    m = len(y)
    f = h(theta, X, eps=10**-7)
    j = -np.sum(np.multiply(y, np.log(f)) +
                np.multiply(1 - y, np.log(1 - f)), axis=0)/m
    if lamb > 0:
        j += lamb/(2*m) * np.sum(np.power(theta[1:],2))
    return j

def dJ(h,theta,X,y,lamb=0):
    g = 1.0/y.shape[0]*(X.T*(h(theta,X)-y))
    if lamb > 0:
        g[1:] += lamb/float(y.shape[0]) * theta[1:]
    return g

def classifyBi(theta, X):
    prob = h(theta, X)
    return prob
# Metoda gradientu prostego dla regresji logistycznej
def GD(h, fJ, fdJ, theta, X, y, alpha=0.01, eps=10**-3, maxSteps=10000):
errorCurr = fJ(h, theta, X, y)
errors = [[errorCurr, theta]]
while True:
# oblicz nowe theta
theta = theta - alpha * fdJ(h, theta, X, y)
# raportuj poziom błędu
errorCurr, errorPrev = fJ(h, theta, X, y), errorCurr
# kryteria stopu
if abs(errorPrev - errorCurr) <= eps:
break
if len(errors) > maxSteps:
break
errors.append([errorCurr, theta])
return theta, errors# Uruchomienie metody gradientu prostego dla regresji logistycznej
theta_start = np.matrix(np.zeros(Xpl.shape[1])).reshape(Xpl.shape[1],1)
theta, errors = GD(h, J, dJ, theta_start, Xpl, Ypl,
alpha=0.1, eps=10**-7, maxSteps=10000)
print(r'theta = {}'.format(theta))theta = [[ 1.59558981] [ 0.12602307] [ 0.65718518] [-5.26367581] [ 1.96832544] [-6.97946065]]
# Wykres granicy klas
def plot_decision_boundary(fig, theta, X):
    ax = fig.axes[0]
    xx, yy = np.meshgrid(np.arange(-1.0, 1.0, 0.02),
                         np.arange(-1.0, 1.0, 0.02))
    l = len(xx.ravel())
    C = powerme(xx.reshape(l, 1), yy.reshape(l, 1), n)
    z = classifyBi(theta, C).reshape(int(np.sqrt(l)), int(np.sqrt(l)))

    plt.contour(xx, yy, z, levels=[0.5], lw=3);
fig = plot_data_for_classification(Xpl, Ypl, xlabel=r'$x_1$', ylabel=r'$x_2$')
plot_decision_boundary(fig, theta, Xpl)/home/pawel/.local/lib/python2.7/site-packages/matplotlib/contour.py:967: UserWarning: The following kwargs were not used by contour: 'lw' s)
# Wczytanie danych
alldata = pandas.read_csv('polynomial_logistic.tsv', sep='\t')
data = np.matrix(alldata)
m, n_plus_1 = data.shape
Xn = data[:, 1:]
n = 10
Xpl = powerme(data[:, 1], data[:, 2], n)
Ypl = np.matrix(data[:, 0]).reshape(m, 1)
theta_start = np.matrix(np.zeros(Xpl.shape[1])).reshape(Xpl.shape[1],1)
theta, errors = GD(h, J, dJ, theta_start, Xpl, Ypl,
alpha=0.1, eps=10**-7, maxSteps=10000)# Przykład dla większej liczby cech
fig = plot_data_for_classification(Xpl, Ypl, xlabel=r'$x_1$', ylabel=r'$x_2$')
plot_decision_boundary(fig, theta, Xpl)2.6. Problem nadmiernego dopasowania
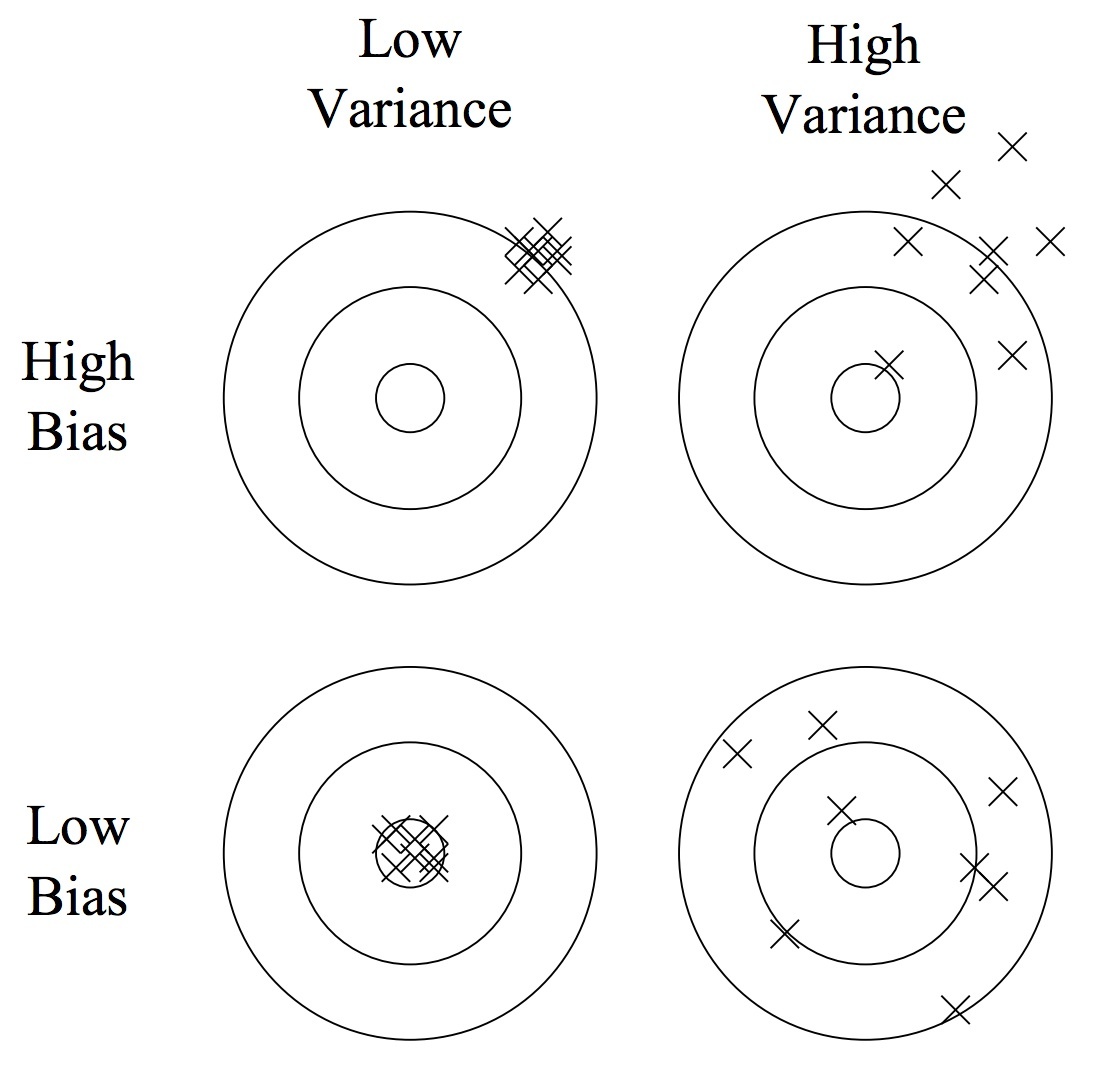
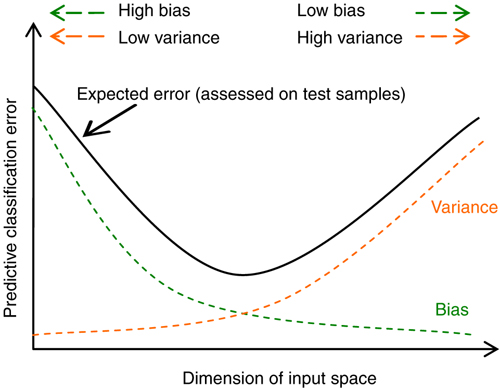
Obciążenie a wariancja
# Dane do prostego przykładu

data = np.matrix([
        [0.0, 0.0],
        [0.5, 1.8],
        [1.0, 4.8],
        [1.6, 7.2],
        [2.6, 8.8],
        [3.0, 9.0],
    ])

m, n_plus_1 = data.shape
n = n_plus_1 - 1
Xn1 = data[:, 0:n]
Xn1 /= np.amax(Xn1, axis=0)
Xn2 = np.power(Xn1, 2)
Xn2 /= np.amax(Xn2, axis=0)
Xn3 = np.power(Xn1, 3)
Xn3 /= np.amax(Xn3, axis=0)
Xn4 = np.power(Xn1, 4)
Xn4 /= np.amax(Xn4, axis=0)
Xn5 = np.power(Xn1, 5)
Xn5 /= np.amax(Xn5, axis=0)

X1 = np.matrix(np.concatenate((np.ones((m, 1)), Xn1), axis=1)).reshape(m, n + 1)
X2 = np.matrix(np.concatenate((np.ones((m, 1)), Xn1, Xn2), axis=1)).reshape(m, 2 * n + 1)
X5 = np.matrix(np.concatenate((np.ones((m, 1)), Xn1, Xn2, Xn3, Xn4, Xn5), axis=1)).reshape(m, 5 * n + 1)
y = np.matrix(data[:, -1]).reshape(m, 1)
fig = plot_data(X1, y, xlabel='x', ylabel='y')fig = plot_data(X1, y, xlabel='x', ylabel='y')
theta_start = np.matrix([0, 0]).reshape(2, 1)
theta, _ = gradient_descent(cost, gradient, theta_start, X1, y, eps=0.00001)
plot_fun(fig, polynomial_regression(theta), X1)[<matplotlib.lines.Line2D at 0x7f3a5ac3d1d0>]
Ten model ma duże obciążenie (błąd systematyczny, _bias) – zachodzi niedostateczne dopasowanie (underfitting).
fig = plot_data(X2, y, xlabel='x', ylabel='y')
theta_start = np.matrix([0, 0, 0]).reshape(3, 1)
theta, _ = gradient_descent(cost, gradient, theta_start, X2, y, eps=0.000001)
plot_fun(fig, polynomial_regression(theta), X1)
[<matplotlib.lines.Line2D at 0x7f3a5aac3350>]
Ten model jest odpowiednio dopasowany.
fig = plot_data(X5, y, xlabel='x', ylabel='y')
theta_start = np.matrix([0, 0, 0, 0, 0, 0]).reshape(6, 1)
theta, _ = gradient_descent(cost, gradient, theta_start, X5, y, alpha=0.5, eps=10**-7)
plot_fun(fig, polynomial_regression(theta), X1)
[<matplotlib.lines.Line2D at 0x7f3a5aa200d0>]
Ten model ma dużą wariancję (_variance) – zachodzi nadmierne dopasowanie (overfitting).
Obciążenie (błąd systematyczny, _bias)
- Wynika z błędnych założeń co do algorytmu uczącego się.
- Duże obciążenie powoduje niedostateczne dopasowanie.
Wariancja (_variance)
- Wynika z nadwrażliwości na niewielkie fluktuacje w zbiorze uczącym.
- Wysoka wariancja może spowodować nadmierne dopasowanie (modelując szum zamiast sygnału).
2.7. Metodologia testowania
Zbiór uczący a zbiór testowy
- Na zbiorze uczącym (treningowym) uczymy algorytmy, a na zbiorze testowym sprawdzamy ich poprawność.
- Zbiór uczący powinien być kilkukrotnie większy od testowego (np. 4:1, 9:1 itp.).
- Zbiór testowy często jest nieznany.
- Należy unikać mieszania danych testowych i treningowych – nie wolno „zanieczyszczać” danych treningowych danymi testowymi!
Czasami potrzebujemy dobrać parametry modelu, np. $\alpha$ – który zbiór wykorzystać do tego celu?
Zbiór walidacyjny
Do doboru parametrów najlepiej użyć jeszcze innego zbioru – jest to tzw. zbiór walidacyjny
- Zbiór walidacyjny powinien mieć wielkość zbliżoną do wielkości zbioru testowego, czyli np. dane można podzielić na te trzy zbiory w proporcjach 3:1:1, 8:1:1 itp.
Walidacja krzyżowa
Którą część danych wydzielić jako zbiór walidacyjny tak, żeby było „najlepiej”?
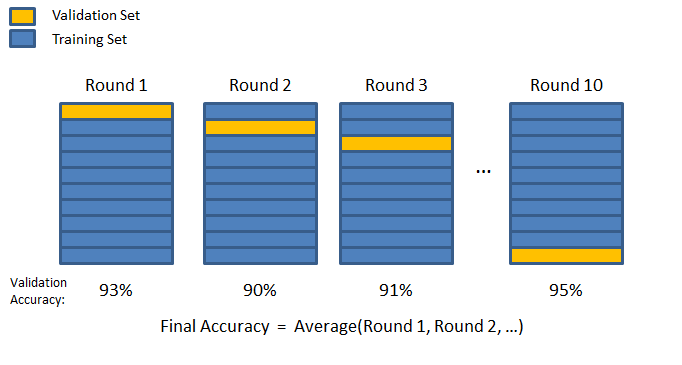
- Niech każda partia danych pełni tę rolę naprzemiennie!
Walidacja krzyżowa
- Podziel dane $D = \left\{ (x^{(1)}, y^{(1)}), \ldots, (x^{(m)}, y^{(m)})\right\} $ na $N$ rozłącznych zbiorów $T_1,\ldots,T_N$
- Dla $i=1,\ldots,N$, wykonaj:
- Użyj $T_i$ do walidacji i zbiór $S_i$ do trenowania, gdzie $S_i = D \smallsetminus T_i$.
- Zapisz model $\theta_i$.
- Akumuluj wyniki dla modeli $\theta_i$ dla zbiorów $T_i$.
- Ustalaj parametry uczenia na akumulowanych wynikach.
Walidacja krzyżowa – wskazówki
- Zazwyczaj ustala się $N$ w przedziale od $4$ do $10$, tzw. $N$-krotna walidacja krzyżowa (_$N$-fold cross validation).
- Zbiór $D$ warto zrandomizować przed podziałem.
- W jaki sposób akumulować wyniki dla wszystkich zbiórow $T_i$?
- Po ustaleniu parametrów dla każdego $T_i$, trenujemy model na całych danych treningowych z ustalonymi parametrami.
- Testujemy na zbiorze testowym (jeśli nim dysponujemy).
_Leave-one-out
Jest to szczególny przypadek walidacji krzyżowej, w której $N = m$.
- Jaki jest rozmiar pojedynczego zbioru $T_i$?
- Jakie są zalety i wady tej metody?
- Kiedy może być przydatna?
Zbiór walidujący a algorytmy optymalizacji
- Gdy błąd rośnie na zbiorze uczącym, mamy źle dobrany parametr $\alpha$. Należy go wtedy zmniejszyć.
- Gdy błąd zmniejsza się na zbiorze trenującym, ale rośnie na zbiorze walidującym, mamy do czynienia ze zjawiskiem nadmiernego dopasowania (_overfitting).
- Należy wtedy przerwać optymalizację. Automatyzacja tego procesu to _early stopping.
2.8. Regularyzacja
def SGD(h, fJ, fdJ, theta, X, Y,
        alpha=0.001, maxEpochs=1.0, batchSize=100,
        adaGrad=False, logError=False, validate=0.0, valStep=100, lamb=0, trainsetsize=1.0):
    errorsX, errorsY = [], []
    errorsVX, errorsVY = [], []

    XT, YT = X, Y

    m_end=int(trainsetsize*len(X))

    if validate > 0:
        mv = int(X.shape[0] * validate)
        XV, YV = X[:mv], Y[:mv]
        XT, YT = X[mv:m_end], Y[mv:m_end]
    m, n = XT.shape

    start, end = 0, batchSize
    maxSteps = (m * float(maxEpochs)) / batchSize

    if adaGrad:
        hgrad = np.matrix(np.zeros(n)).reshape(n,1)

    for i in range(int(maxSteps)):
        XBatch, YBatch =  XT[start:end,:], YT[start:end,:]

        grad = fdJ(h, theta, XBatch, YBatch, lamb=lamb)
        if adaGrad:
            hgrad += np.multiply(grad, grad)
            Gt = 1.0 / (10**-7 + np.sqrt(hgrad))
            theta = theta - np.multiply(alpha * Gt, grad)
        else:
            theta = theta - alpha * grad

        if logError:
            errorsX.append(float(i*batchSize)/m)
            errorsY.append(fJ(h, theta, XBatch, YBatch).item())
            if validate > 0 and i % valStep == 0:
                errorsVX.append(float(i*batchSize)/m)
                errorsVY.append(fJ(h, theta, XV, YV).item())

        if start + batchSize < m:
            start += batchSize
        else:
            start = 0
        end = min(start + batchSize, m)
    return theta, (errorsX, errorsY, errorsVX, errorsVY)
# Przygotowanie danych do przykładu regularyzacji
n = 6
data = np.matrix(np.loadtxt("ex2data2.txt", delimiter=","))
np.random.shuffle(data)
X = powerme(data[:,0], data[:,1], n)
Y = data[:,2]def draw_regularization_example(X, Y, lamb=0, alpha=1, adaGrad=True, maxEpochs=2500, validate=0.25):
plt.figure(figsize=(16,8))
plt.subplot(121)
plt.scatter(X[:, 2].tolist(), X[:, 1].tolist(),
c=Y.tolist(),
s=100, cmap=plt.cm.get_cmap('prism'));
theta = np.matrix(np.zeros(X.shape[1])).reshape(X.shape[1],1)
thetaBest, err = SGD(h, J, dJ, theta, X, Y, alpha=alpha, adaGrad=adaGrad, maxEpochs=maxEpochs, batchSize=100,
logError=True, validate=validate, valStep=1, lamb=lamb)
xx, yy = np.meshgrid(np.arange(-1.5, 1.5, 0.02),
np.arange(-1.5, 1.5, 0.02))
l = len(xx.ravel())
C = powerme(xx.reshape(l, 1),yy.reshape(l, 1), n)
z = classifyBi(thetaBest, C).reshape(int(np.sqrt(l)), int(np.sqrt(l)))
plt.contour(xx, yy, z, levels=[0.5], lw=3);
plt.ylim(-1,1.2);
plt.xlim(-1,1.2);
plt.legend();
plt.subplot(122)
plt.plot(err[0],err[1], lw=3, label="Training error")
if validate > 0:
plt.plot(err[2],err[3], lw=3, label="Validation error");
plt.legend()
plt.ylim(0.2,0.8);draw_regularization_example(X, Y)/home/pawel/.local/lib/python2.7/site-packages/ipykernel_launcher.py:2: RuntimeWarning: overflow encountered in exp
Regularyzacja
- Metoda zapobiegania zjawisku nadmiernego dopasowania (_overfitting)
- „Kara” za ekstremalne wartości parametrów $\theta$
Regularyzacja dla regresji liniowej – funkcja kosztu
$$ J(\theta) , = , \dfrac{1}{2m} \left( \displaystyle\sum_{i=1}^{m} h_\theta(x^{(i)}) - y^{(i)} \color{red}{ + \lambda \displaystyle\sum_{j=1}^{n} \theta^2_j } \right) $$
- $\lambda$ – parametr regularyzacji
- jeżeli $\lambda$ jest zbyt mały, skutkuje to nadmiernym dopasowaniem
- jeżeli $\lambda$ jest zbyt duży, skutkuje to niedostatecznym dopasowaniem
Regularyzacja dla regresji liniowej – gradient
$$\small \begin{array}{llll} \dfrac{\partial J(\theta)}{\partial \theta_0} &=& \dfrac{1}{m}\displaystyle\sum_{i=1}^m \left( h_{\theta}(x^{(i)})-y^{(i)} \right) x^{(i)}_0 & \textrm{dla $j = 0$ }\\ \dfrac{\partial J(\theta)}{\partial \theta_j} &=& \dfrac{1}{m}\displaystyle\sum
Regularyzacja dla regresji logistycznej – funkcja kosztu
$$ \begin{array}{rtl} J(\theta) & = & -\dfrac{1}{m} \left( \displaystyle\sum_{i=1}^{m} y^{(i)} \log h_\theta(x^{(i)}) + \left( 1-y^{(i)} \right) \log \left( 1-h_\theta(x^{(i)}) \right) \right) \\ & & \color{red}{ + \dfrac{\lambda}{2m} \displaystyle\sum_{j=1}^{n} \theta^2_j } \\ \end{array} $$
Regularyzacja dla regresji logistycznej – gradient
$$\small \begin{array}{llll} \dfrac{\partial J(\theta)}{\partial \theta_0} &=& \dfrac{1}{m}\displaystyle\sum_{i=1}^m \left( h_{\theta}(x^{(i)})-y^{(i)} \right) x^{(i)}_0 & \textrm{dla $j = 0$ }\\ \dfrac{\partial J(\theta)}{\partial \theta_j} &=& \dfrac{1}{m}\displaystyle\sum
Implementacja metody regularyzacji
def J_(h,theta,X,y,lamb=0):
    m = float(len(y))
    f = h(theta, X, eps=10**-7)
    j = 1.0/m \
        * -np.sum(np.multiply(y, np.log(f)) +
                  np.multiply(1 - y, np.log(1 - f)), axis=0) \
        + lamb/(2*m) * np.sum(np.power(theta[1:] ,2))
    return j

def dJ_(h,theta,X,y,lamb=0):
    m = float(y.shape[0])
    g = 1.0/y.shape[0]*(X.T*(h(theta,X)-y))
    g[1:] += lamb/m * theta[1:]
    return g
slider_lambda = widgets.FloatSlider(min=0.0, max=0.5, step=0.005, value=0.01, description=r'$\lambda$', width=300)
def slide_regularization_example_2(lamb):
draw_regularization_example(X, Y, lamb=lamb)widgets.interact_manual(slide_regularization_example_2, lamb=slider_lambda)Failed to display Jupyter Widget of type interactive.
If you're reading this message in Jupyter Notebook or JupyterLab, it may mean that the widgets JavaScript is still loading. If this message persists, it likely means that the widgets JavaScript library is either not installed or not enabled. See the Jupyter Widgets Documentation for setup instructions.
If you're reading this message in another notebook frontend (for example, a static rendering on GitHub or NBViewer), it may mean that your frontend doesn't currently support widgets.
<function __main__.slide_regularization_example_2>
def cost_lambda_fun(lamb):
    theta = np.matrix(np.zeros(X.shape[1])).reshape(X.shape[1],1)
    thetaBest, err = SGD(h, J, dJ, theta, X, Y, alpha=1, adaGrad=True, maxEpochs=2500, batchSize=100,
                         logError=True, validate=0.25, valStep=1, lamb=lamb)
    return err[1][-1], err[3][-1]

def plot_cost_lambda():
    plt.figure(figsize=(16,8))
    ax = plt.subplot(111)
    Lambda = np.arange(0.0, 1.0, 0.01)
    Costs = [cost_lambda_fun(lamb) for lamb in Lambda]
    CostTrain = [cost[0] for cost in Costs]
    CostCV = [cost[1] for cost in Costs]
    plt.plot(Lambda, CostTrain, lw=3, label='training error')
    plt.plot(Lambda, CostCV, lw=3, label='validation error')
    ax.set_xlabel(r'$\lambda$')
    ax.set_ylabel(u'cost')
    plt.legend()
plt.ylim(0.2,0.8)plot_cost_lambda()2.9. Krzywa uczenia się
- Krzywa uczenia pozwala sprawdzić, czy uczenie przebiega poprawnie.
- Krzywa uczenia to wykres zależności między wielkością zbioru treningowego a wartością funkcji kosztu.
- Wraz ze wzrostem wielkości zbioru treningowego wartość funkcji kosztu na zbiorze treningowym rośnie.
- Wraz ze wzrostem wielkości zbioru treningowego wartość funkcji kosztu na zbiorze walidacyjnym maleje.
def cost_trainsetsize_fun(m):
    theta = np.matrix(np.zeros(X.shape[1])).reshape(X.shape[1],1)
    thetaBest, err = SGD(h, J, dJ, theta, X, Y, alpha=1, adaGrad=True, maxEpochs=2500, batchSize=100,
                         logError=True, validate=0.25, valStep=1, lamb=0.01, trainsetsize=m)
    return err[1][-1], err[3][-1]

def plot_learning_curve():
    plt.figure(figsize=(16,8))
    ax = plt.subplot(111)
    M = np.arange(0.3, 1.0, 0.05)
    Costs = [cost_trainsetsize_fun(m) for m in M]
    CostTrain = [cost[0] for cost in Costs]
    CostCV = [cost[1] for cost in Costs]
    plt.plot(M, CostTrain, lw=3, label='training error')
    plt.plot(M, CostCV, lw=3, label='validation error')
    ax.set_xlabel(u'trainset size')
    ax.set_ylabel(u'cost')
    plt.legend()
Krzywa uczenia a obciążenie i wariancja

Źródło: http://www.ritchieng.com/machinelearning-learning-curve
plot_learning_curve()2.10. Obserwacje odstające
# Funkcja regresji liniowej

def h_linear(Theta, x):
    return x * Theta

def linear_regression(theta):
    return lambda x: h_linear(theta, x)

# Wykres krzywej regresji (wersja macierzowa)
def plot_regression(fig, fun, theta, X):
    ax = fig.axes[0]
    x0 = np.min(X[:, 1]) - 1.0
    x1 = np.max(X[:, 1]) + 1.0
    L = [x0, x1]
    LX = np.matrix([1, x0, 1, x1]).reshape(2, 2)
    ax.plot(L, fun(theta, LX), linewidth='2',
            label=(r'$y={theta0:.2}{op}{theta1:.2}x$'.format(
                theta0=float(theta[0][0]),
                theta1=(float(theta[1][0]) if theta[1][0] >= 0 else float(-theta[1][0])),
                op='+' if theta[1][0] >= 0 else '-')))
# Wczytanie danych (mieszkania) przy pomocy biblioteki pandas
alldata = pandas.read_csv('data_flats_with_outliers.tsv', sep='\t',
names=['price', 'isNew', 'rooms', 'floor', 'location', 'sqrMetres'])
data = np.matrix(alldata[['price', 'sqrMetres']])
m, n_plus_1 = data.shape
n = n_plus_1 - 1
Xn = data[:, 0:n]
Xo = np.matrix(np.concatenate((np.ones((m, 1)), Xn), axis=1)).reshape(m, n + 1)
yo = np.matrix(data[:, -1]).reshape(m, 1)
Xo /= np.amax(Xo, axis=0)
yo /= np.amax(yo, axis=0)fig = plot_data(Xo, yo, xlabel=u'metraż', ylabel=u'cena')
theta_start = np.matrix([0.0, 0.0]).reshape(2, 1)
theta, logs = gradient_descent(cost, gradient, theta_start, Xo, yo, alpha=0.01)
plot_regression(fig, h_linear, theta, Xo)# Odrzućmy obserwacje odstające
alldata_no_outliers = [
(index, item) for index, item in alldata.iterrows()
if item.price > 100 and item.sqrMetres > 10]
alldata_no_outliers = alldata.loc[(alldata['price'] > 100) & (alldata['sqrMetres'] > 100)]data = np.matrix(alldata_no_outliers[['price', 'sqrMetres']])
m, n_plus_1 = data.shape
n = n_plus_1 - 1
Xn = data[:, 0:n]
Xo = np.matrix(np.concatenate((np.ones((m, 1)), Xn), axis=1)).reshape(m, n + 1)
yo = np.matrix(data[:, -1]).reshape(m, 1)
Xo /= np.amax(Xo, axis=0)
yo /= np.amax(yo, axis=0)fig = plot_data(Xo, yo, xlabel=u'metraż', ylabel=u'cena')
theta_start = np.matrix([0.0, 0.0]).reshape(2, 1)
theta, logs = gradient_descent(cost, gradient, theta_start, Xo, yo, alpha=0.01)
plot_regression(fig, h_linear, theta, Xo)


 Żródło: