25 KiB
Wizualizacja danych (Lab 5)
library(repr) # To resize plots in Jupyter
options(repr.plot.width = 16, repr.plot.height = 9)
library(shiny) # Main library
library(ggplot2) # Plots
library(dplyr) # Data manipulate
library(babynames) # Data setWarning message: “package ‘ggplot2’ was built under R version 3.6.2” Warning message: “package ‘dplyr’ was built under R version 3.6.2” Attaching package: ‘dplyr’ The following objects are masked from ‘package:stats’: filter, lag The following objects are masked from ‘package:base’: intersect, setdiff, setequal, union
shiny
_shiny to pakiet R, który ułatwia tworzenie wysoce interaktywnych aplikacji internetowych bezpośrednio w R. Korzystając z shiny, analitycy danych mogą tworzyć interaktywne aplikacje internetowe, które umożliwiają zespołowi zanurzenie się i eksplorowanie danych w postaci pulpitów nawigacyjnych (dashboard) lub wizualizacji.

Podstawowa budowa aplikacji _shiny
library(shiny) # Load shiny library
ui <- fluidPage() # Create the UI with a HTML
server <- function(input, output, session) {} # Define a custom function to create the server
shinyApp(ui = ui, server = server) # Run the app
- Add inputs (UI)
- Add outputs (UI/Server)
- Update layout (UI)
- Update outputs (Server)
_shiny zapewnia szeroką gamę danych wejściowych, które pozwalają użytkownikom zapewnić następujące dane:
- tekst (_textInput, selectInput),
- liczby (_numericInput, sliderInput),
- wartośći logiczne (_checkBoxInput, radioInput),
- daty (_dateInput, dateRangeInput).
Wyjście:
- _textOutput, renderText,
- _tableOutput, renderTable,
- _imageOutput, renderImage,
- _plotOutput, renderPlot,
- _DT::DTOutput(), DT::renderDT() - interaktywne tabele.
ui <- fluidPage(
  textInput('name', 'What is your name?'), # Input
  textOutput('greeting') # Output
)

server <- function(input, output) {
  output$greeting <- renderText({
    paste('Hello', input$name)
  })
}

shinyApp(ui = ui, server = server)head(babynames)| year | sex | name | n | prop |
|---|---|---|---|---|
| <dbl> | <chr> | <chr> | <int> | <dbl> |
| 1880 | F | Mary | 7065 | 0.07238 |
| 1880 | F | Anna | 2604 | 0.02668 |
| 1880 | F | Emma | 2003 | 0.02052 |
| 1880 | F | Elizabeth | 1939 | 0.01987 |
| 1880 | F | Minnie | 1746 | 0.01789 |
| 1880 | F | Margaret | 1578 | 0.01617 |
ui <- fluidPage(
  titlePanel('Baby Name Explorer'),
  textInput('name', 'Enter Name', 'Tomas'),
  plotOutput('trend')
)

server <- function(input, output, session) {
  output$trend <- renderPlot({
    babynames %>%
      filter(name == input$name) %>%
      ggplot(aes(x = year, y = prop, color = sex)) +
      geom_line()
  })
}

shinyApp(ui = ui, server = server)
ui <- fluidPage(
titlePanel("What's in a Name?"),
selectInput('sex',
'Select sex',
selected = 'F',
choices = c('F', 'M')),
sliderInput('year',
'Select year',
value = 1900,
min = 1880,
max = 2017),
plotOutput('PlotTopNames')
)
server <- function(input, output, session){
output$PlotTopNames <- renderPlot({
babynames %>%
filter(sex == input$sex, year == input$year) %>%
top_n(10, prop) %>%
ggplot(aes(x = name, y = prop)) +
geom_col(fill = 'navy')
})
}
shinyApp(ui = ui, server = server)ui <- fluidPage(
titlePanel("What's in a Name?"),
selectInput('sex',
'Select sex',
selected = 'F',
choices = c('M', 'F')),
sliderInput('year',
'Select year',
min = 1880,
max = 2017,
value = 1900),
DT::dataTableOutput('tableNames')
)
server <- function(input, output, session){
output$tableNames <- DT::renderDataTable({
babynames %>%
filter(sex == input$sex) %>%
filter(year == input$year) %>%
DT::datatable()
})
}
shinyApp(ui = ui, server = server)Layputy i szablony
Layout. Layout functions allow inputs and outputs to be visually arranged in the UI. A well-chosen layout makes a _shiny app aesthetically more appealing, and also improves the user experience.
Theme. _shiny makes it easy to customize the theme of an app. The UI functions in shiny make use of Twitter Bootstrap, a popular framework for building web applications. There are a lot of built-in themes in shinythemes library, and if none of them suit your fancy, you can learn how to further customize your app with custom CSS.
# Layout

ui <- fluidPage(
  titlePanel("What's in a Name?"),
  sidebarLayout(
    sidebarPanel(
      selectInput('sex',
                  'Select sex',
                  selected = 'F',
                  choices = c('M', 'F')),
      sliderInput('year',
                  'Select year',
                  min = 1880,
                  max = 2017,
                  value = 1900)
    ),
    mainPanel(
      tabsetPanel(tabPanel('Table',
                           DT::dataTableOutput('tableNames')),
                  tabPanel('Plot',
                           plotOutput('PlotTopNames'))
      )
    )
  )
)

server <- function(input, output, session){
  output$tableNames <- DT::renderDataTable({
    babynames %>%
      filter(sex == input$sex) %>%
      filter(year == input$year) %>%
      DT::datatable()
  })

  output$PlotTopNames <- renderPlot({
    babynames %>%
      filter(sex == input$sex, year == input$year) %>%
      top_n(10, prop) %>%
      ggplot(aes(x = name, y = prop)) +
      geom_col(fill = 'navy')
  })
}

shinyApp(ui = ui, server = server)
# Themes
ui <- fluidPage(
shinythemes::themeSelector(),
theme = shinythemes::shinytheme('flatly'),
titlePanel("What's in a Name?"),
selectInput('sex',
'Select sex',
selected = 'F',
choices = c('M', 'F')),
sliderInput('year',
'Select year',
min = 1880,
max = 2017,
value = 1900),
DT::dataTableOutput('tableNames')
)
server <- function(input, output, session){
output$tableNames <- DT::renderDataTable({
babynames %>%
filter(sex == input$sex) %>%
filter(year == input$year) %>%
DT::datatable()
})
}
shinyApp(ui = ui, server = server)Reactive
The magic behind Shiny is driven by _reactivity. There are three types of reactive components in a Shiny app.
- Reactive source: User input that comes through a browser interface, typically.
- Reactive conductor: Reactive component between a source and an endpoint, typically used to encapsulate slow computations.
- Reactive endpoint: Something that appears in the user's browser window, such as a plot or a table of values.
Reactive expressions are _lazy (evaluated only when it is called) and cached (evaluated only when the value of one of its underlying dependencies changes).
ui <- fluidPage(
  titlePanel('BMI Calculator'),
  sidebarLayout(
    sidebarPanel(
      numericInput('height', 'Enter your height in meters', 1.7, 1, 2.2),
      numericInput('weight', 'Enter your weight in Kilograms', 70, 35, 200)
    ),
    mainPanel(
      textOutput('bmi'),
      textOutput('bmiRange')
    )
  )
)

server <- function(input, output, session) {
  rvalBMI <- reactive({
    input$weight / (input$height^2)
  })

  output$bmi <- renderText({
    bmi <- rvalBMI() # First call
    paste('Your BMI is', round(bmi, 1))
  })

  output$bmiRange <- renderText({
    bmi <- rvalBMI() # Second call (we used cached data)
    bmiStatus <- cut(bmi,
                     breaks = c(0, 18.5, 24.9, 29.9, 100),
                     labels = c('underweight', 'healthy', 'overweight', 'obese')
    )
    paste('You are', bmiStatus)
  })
}

shinyApp(ui = ui, server = server)
Observers
An _observer is used for side effects, like displaying a plot, table, or text in the browser. By default an observer triggers an action, whenever one of its underlying dependencies change. As we are triggering an action using an observer, we do not need to use a render**()* function or assign the results to an output.
ui <- fluidPage(
  textInput('name', 'Enter your name')
)

server <- function(input, output, session) {
  observe({
    showNotification(
      paste('You entered the name', input$name)
    )
  })
}

shinyApp(ui = ui, server = server)
Observers vs. reactives
- Role
- _reactive() is for calculating values, without side effects.
- _observe() is for performing actions, with side effects.
- Differences
- Reactive expressions return values, but observers don't.
- Observers eagerly respond to changes in their dependencies, while reactive expressions are lazy.
- Observers are primarily useful for their side effects, whereas, reactive expressions must not have side effects.
Stop, delay, trigger
Stop
The _isolate() function allows an expression to read a reactive value without triggering re-execution when its value changes.
Delay
The function _eventReactive() is used to compute a reactive value that only updates in response to a specific event.
Trigger
There are times when you want to perform an action in response to an event. The _observeEvent() function allows you to achieve this.
# Isolate
ui <- fluidPage(
  titlePanel('BMI Calculator'),
  sidebarLayout(
    sidebarPanel(
      textInput('name', 'Enter your name'),
      numericInput('height', 'Enter your height in meters', 1.7, 1, 2.2),
      numericInput('weight', 'Enter your weight in Kilograms', 70, 35, 200)
    ),
    mainPanel(
      textOutput('bmi')
    )
  )
)

server <- function(input, output, session) {
  rvalBMI <- reactive({
    input$weight / (input$height^2)
  })

  output$bmi <- renderText({
    bmi <- rvalBMI()
    paste('Hi', isolate({input$name}), '. Your BMI is', round(bmi, 1))
  })
}

shinyApp(ui = ui, server = server)
# eventReactive
ui <- fluidPage(
titlePanel('BMI Calculator'),
sidebarLayout(
sidebarPanel(
textInput('name', 'Enter your name'),
numericInput('height', 'Enter your height in meters', 1.7, 1, 2.2),
numericInput('weight', 'Enter your weight in Kilograms', 70, 35, 200),
actionButton('showBMI', 'Show BMI')
),
mainPanel(
textOutput('bmi')
)
)
)
server <- function(input, output, session) {
# Delay the calculation until the user clicks on the showBMI button (Show BMI)
rvalBMI <- eventReactive(input$showBMI, {
input$weight/(input$height^2)
})
output$bmi <- renderText({
bmi <- rvalBMI()
paste("Hi", input$name, ". Your BMI is", round(bmi, 1))
})
}
shinyApp(ui = ui, server = server)# observeEvent
bmiHelpText <- "Body Mass Index is a simple calculation using a person's height and weight. The formula is BMI = kg/m2 where kg is a person's weight in kilograms and m2 is their height in metres squared. A BMI of 25.0 or more is overweight, while the healthy range is 18.5 to 24.9."
ui <- fluidPage(
titlePanel('BMI Calculator'),
sidebarLayout(
sidebarPanel(
textInput('name', 'Enter your name'),
numericInput('height', 'Enter your height in meters', 1.7, 1, 2.2),
numericInput('weight', 'Enter your weight in Kilograms', 70, 35, 200),
actionButton('showBMI', 'Show BMI'),
actionButton('showHelp', 'Help')
),
mainPanel(
textOutput('bmi')
)
)
)
server <- function(input, output, session) {
# The help text is displayed when a user clicks on the Help button.
observeEvent(input$showHelp, {
showModal(modalDialog(bmiHelpText))
})
rvalBMI <- eventReactive(input$showBMI, {
input$weight / (input$height^2)
})
output$bmi <- renderText({
bmi <- rvalBMI()
paste('Hi', input$name, '. Your BMI is', round(bmi, 1))
})
}
shinyApp(ui = ui, server = server)Zadania
- Zaprojektowano aplikację, która pozwala użytkownikowi wybrać liczbę pomiędzy 1 a 50 i wyświetlić wynik iloczynu tej liczby i 5.
ui <- fluidPage(
  sliderInput("x", label = "If x is", min = 1, max = 50, value = 30),
  "then x times 5 is",
  textOutput("product")
)

server <- function(input, output, session) {
  output$product <- renderText({
    x * 5
  })
}

shinyApp(ui, server)- Rozbuduj aplikację z poprzedniego ćwiczenia tak, aby pozwala użytkownikowi ustawić wartość mnożnika.
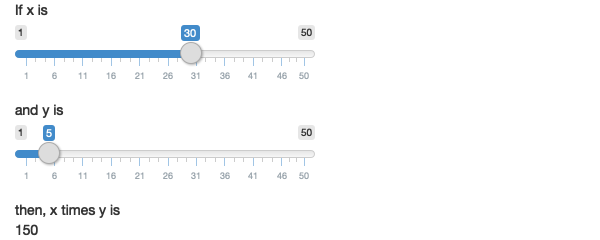
- Kolejna aplikacja dodaje kolejne funkcjonalności. Popraw ją tak (zredukuj ilość zduplikowanego kodu), aby wykorzystać funkcje reaktywne.
ui <- fluidPage(
  sliderInput("x", "If x is", min = 1, max = 50, value = 30),
  sliderInput("y", "and y is", min = 1, max = 50, value = 5),
  "then, (x * y) is", textOutput("product"),
  "and, (x * y) + 5 is", textOutput("product_plus5"),
  "and (x * y) + 10 is", textOutput("product_plus10")
)

server <- function(input, output, session) {
  output$product <- renderText({
    product <- input$x * input$y
    product
  })
  output$product_plus5 <- renderText({
    product <- input$x * input$y
    product + 5
  })
  output$product_plus10 <- renderText({
    product <- input$x * input$y
    product + 10
  })
}

shinyApp(ui, server)- Poniższa aplikacja pozwala wybrać zbiór danych z pakietu _ggplot2, a następnie wyświetla podsumowanie danych i rysuje wykresy. Są w niej jednak trzy błędy. Wskaż je i popraw.
datasets <- c("economics", "faithfuld", "seals")
ui <- fluidPage(
  selectInput("dataset", "Dataset", choices = datasets),
  verbatimTextOutput("summary"),
  tableOutput("plot")
)

server <- function(input, output, session) {
  dataset <- reactive({
    get(input$dataset, "package:ggplot2")
  })
  output$summmry <- renderPrint({
    summary(dataset())
  })
  output$plot <- renderPlot({
    plot(dataset)
  }, res = 96)
}

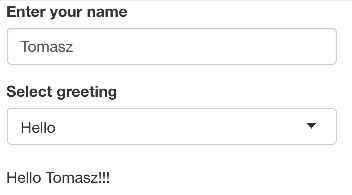
shinyApp(ui, server)- Zbuduj aplikację _shiny, która pozwala wpisać swoje imię i nazwisko oraz wybrać powitanie (Hello/Bonjour) i zwraca „Hello, Tomasz”, gdy użytkownikiem jest Tomasz. Twoja ostateczna aplikacja powinna wizualnie przypominać zrzut ekranu poniżej.
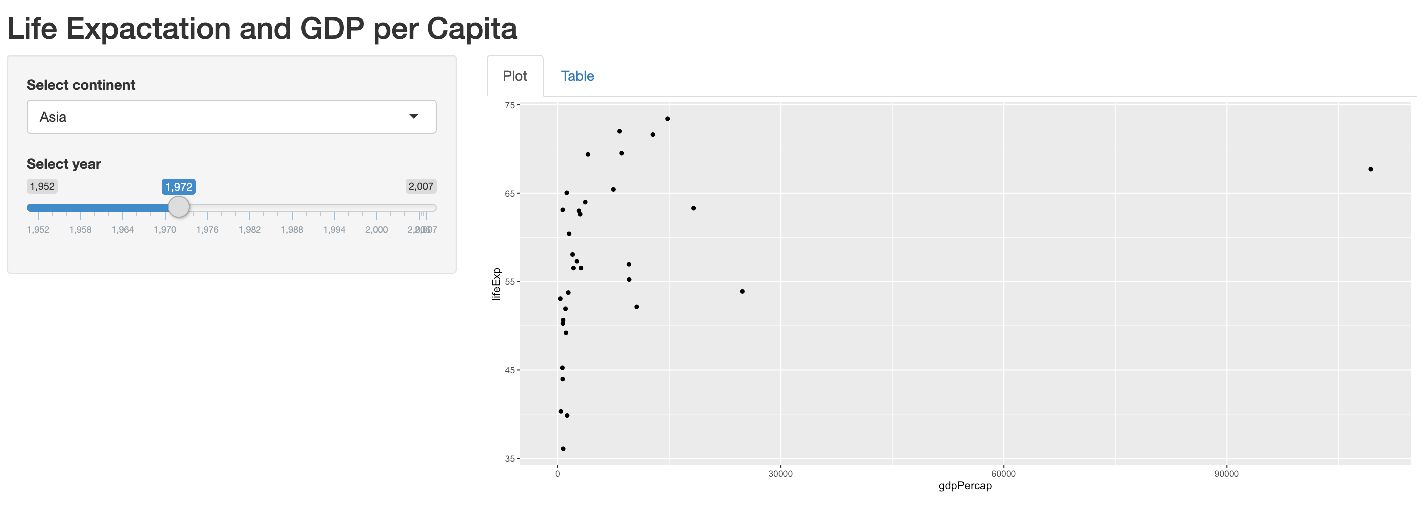
- Dla zbioru danych _gapminder z biblioteki gapminder zbuduj aplikację shiny, która wizualnie powinna przypominać zrzut ekranu poniżej. Powinna istnieć możliwość wyboru kontynentu i roku. Dla wybranych wartości należy przygotować wykres i tabelę na osobnych zakładkach.
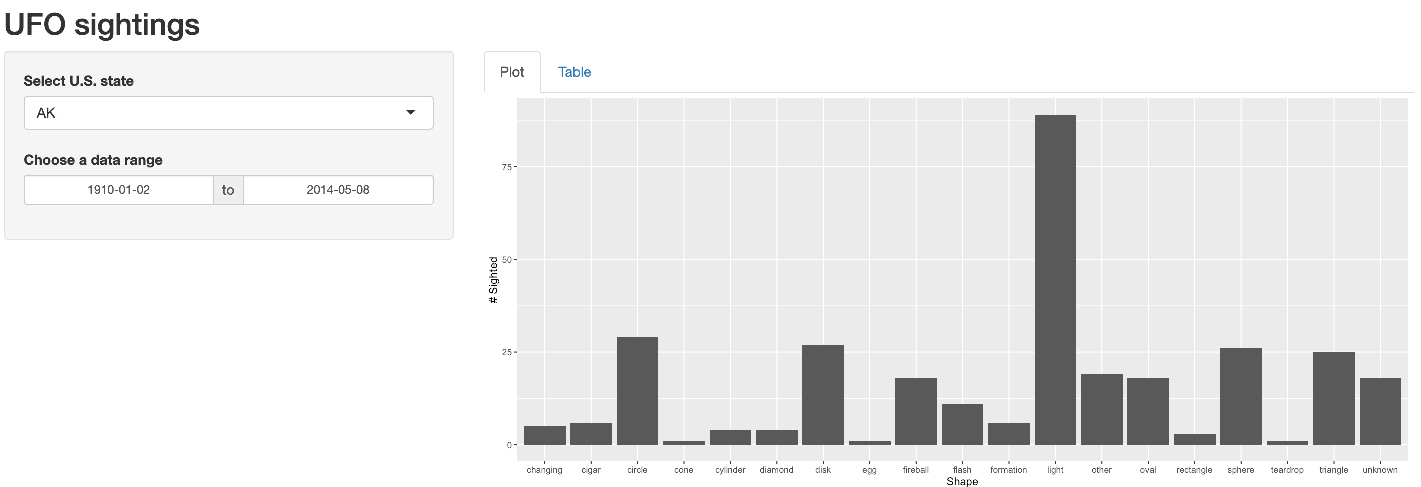
- Narodowe Centrum Raportowania UFO (NUFORC) zbierało dane o zdarzeniach UFO w ciągu ostatniego stulecia (zbiór danych: usaUFOsightings.csv). Zbuduj aplikację, która pozwoli użytkownikom wybrać stan USA i okres, w którym miały miejsce zdarzenia. Wykres powinien pokazywać liczbę zdarzeń dla wybranego stanu i okresu. Tabela powinna pokazywać, dla wybranego stanu i okresu czasu, liczbę zaobserwowanych obserwacji oraz średnią, medianę, minimalny i maksymalny czas trwania (w sekundach) wydarzenia. Twoja ostateczna aplikacja powinna wizualnie przypominać zrzut ekranu poniżej.
